|
Environmental performance indicators (EPIs) provide a helping hand for companies to test out their green fingers
by Leslie Webb
How green is my company?
Gauging environmental performance in the pulp and paper industry is no simple task. The only way to assess a company’s performance is by developing an integrated set of environmental indices that covers its whole range of activities. These indices are sometimes referred to as envirometrics or, more commonly, as environmental performance indicators (EPIs). They are yet another element in the environment manager’s tool-kit which can come in handy in the following cases:
• to establish objectives and targets within environmental management systems such as ISO 14001 and EMAS
• to define criteria and performance levels for product eco-labels and report cards
• to describe performance on a consistent basis within environmental reports and other communications
• to assess the likely environmental impact of industrial sites at the design/planning stage
• in benchmarking exercises within and between industrial sectors.
Standard practice
The International Standards Organization (ISO) has played a prominent part in the battle to bring some cohesion to environmental management. One ISO measure was to set up a sub-committee on environmental performance evaluation (EPE) and the resulting EPE standard (ISO 14031) should be published later this year. ISO 14031 provides guidelines on selecting and using EPIs, while its accompanying technical report (ISO 14032) gives examples of how the standards can be used in various types of organizations in the manufacturing and service sectors.
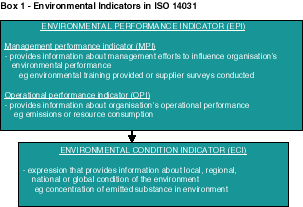
ISO 14032 defines EPE as "a process to facilitate management decisions regarding an organization’s environmental performance by selecting indicators, collecting and analyzing data, assessing information against environmental performance criteria, reporting and communicating, and periodically reviewing and improving this process". Like other ISO standards, the drafting process has made the standard less and less prescriptive to the extent that the final document gives an organization virtually unlimited flexibility in selecting appropriate indicators. What the standard does do is distinguish between three different types of indicator (Box 1). However, it does not mandate any specific indicators, or even types of indicator, or the procedure by which they should be selected. This is an area where ISO 14031 could have been most valuable to ISO 14001 by developing a procedure for identifying significant environmental aspects and associated indicators.

ISO 14031 is aimed at "organizations" - companies, corporations, firms, enterprises, authorities or institutions. The term is fairly all-encompassing, but it does not specifically include aggregations of organizations or larger entities such as countries. Following the Earth Summit in Rio de Janeiro, Brazil, in 1992, many countries started to develop their own sets of indicators to judge environmental performance and individual industry sectors swiftly followed suit. The best known example of the latter is the chemical industry’s ‘Responsible Care’ program, which kicked off in Canada in 1985. The program’s coverage now extends to 42 countries, which account for nearly 90% of global chemical production. In 1996, the International Council of Chemical Associations (ICCA) published its first status report on "Responsible Care" and the second of these biennial reports was published in 1998. Although the establishment of EPIs is an important part of the program within each country, aggregated global data is not yet published in this report. But the identification of appropriate global EPIs remains a priority task for the future. In many cases, national EPIs extend beyond resource consumption and emissions. For example, in the UK, EPIs include aspects related to safety, occupational health, distribution incidents and product stewardship.
Unfortunately, the pulp and paper sector is not as advanced as the chemical industry in compiling and publishing statistics on its collective environmental performance. The European industry has made a start in the last few years with the 1997 Environmental Progress Report, followed by the 1998 Environmental Report from Cepi (the Confederation of European Paper Industries). This report contains some useful data, but is mostly a collection of selected national statistics rather than a synthesis of the pan-European position. There are some exceptions and it is interesting to see some Europe-wide data for consumption of fossil fuels, renewable energy sources and chlorine for pulp bleaching as well as for the emission of BOD (biochemical oxygen demand) to water. But it is disappointing to see seemingly good examples of emission reductions with no absolute units attached, such as the reduction in wastewater suspended solids discharged by the French industry. Hopefully, forthcoming Cepi reports will resist the temptation to cherry-pick the best-performing parameters or countries and will focus on a consistent set of EPIs supported by selected data of topical relevance.
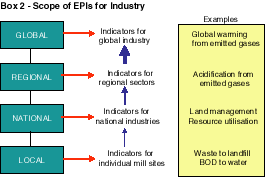
Reporting environmental performance on a country-wide, regional or global basis does raise questions about the appropriateness of the selected indicators (Box 2). Indicators for the mill site itself should address local issues, which would cover most elements of discharges to water and land along with some elements of discharges to air (eg odor). The mill would need to monitor other parameters in order to contribute data for corporate or national/supra-national statistics.

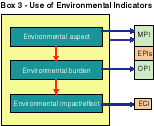
Put simply, indicators are a type of environmental valuation, which can be applied to the three environmental attributes of an organization - its aspects, burdens and effects (Box 3). By far the most commonly used indicators at present are the OPIs (operational performance indicators) as these have been measured for many years in order to comply with local legislation. MPIs (management performance indicators) cover the whole system, but these indicators could make a greater contribution by focusing efforts on process/product design rather than improvement at the post-design or post-production stages. ECIs (environmental condition indicators) are rarely used, perhaps because these measurements are usually made by a regulatory body and not by the company.

Nothing to report?
While there is a clear lack of enthusiasm within the paper industry for eco-labels established by independent organizations, some interest has emerged in the last few years for the ‘report card’ alternative. These are the type III labels described in ISO 14020. The report cards use what are essentially EPIs to depict the eco-profile of a mill or a grade of pulp or paper. At least two such approaches have been developed within the paper industry - one by a national association and one through a joint study between a paper company and printer. The first study was carried out by the Canadian Pulp and Paper Association (CPPA) and is called the ‘Environmental Profile Data Sheet’ (EPDS), while the second is the ‘Product Related Profile’ (PRP) study from UPM-Kymmene and Axel Springer Verlag. The two schemes address the same sorts of aspects/burdens, but the EPDS has a wider coverage involving about 30 individual parameters compared to the 15 within the PRP. All the EPIs cover either aspects or burdens as there are no ECIs in either scheme.
Although neither scheme claims that the data covers the whole life cycle of papers, there are a number of differences between the two studies. The PRP is aimed at printing papers produced on specific paper machines, whereas the EPDS can be used by producers of any paper or pulp. The PRP is from mill gate to the reel and excludes the emissions from any purchased energy in its energy emissions. The EPDS includes forestry aspects and upstream transport emissions plus important generic factors such as management systems and reporting. One of the factors behind developing the PRP was that all of the parameters are usually available in company environmental reports, whereas some of the EPDS indicators are not, but they reflect national legislative requirements.
The report card approach is an ultra-simplified environmental report centered on a particular product or product line rather than the totality of the mill itself. Environmental reports take this a stage or several stages further by providing a more rounded and complete description of either just the site (as in an EMAS statement) or of the whole organization (as in a corporate environmental report). Environmental reports vary enormously in their size and scope as discussed in a previous article (PPI February 1998, pp 30-35). The most comprehensive reports provide data aggregated for the whole company plus data broken down for individual sites, which could be in the form of individual report cards. Looking at a selection of environmental reports from paper companies in different countries, it is evident that quite a few of the parameters are the same as those in the PRP/EPDS schemes. But there is no consistency as to which parameters are included in the report or whether the numerical data should apply to individual sites or the company-wide total.
Short of producing yet another ISO standard on reporting, there is not likely to be much consensus on what environmental reports should include and exclude. We can all devise our own lists of what we would like to see, but one of the large management consultants, Deloitte Touche Tohmatsu, has recently saved us this task by putting together what they call a ‘Score Card’ for corporate environmental reports (Table 1). The Score Card is broken down into eight weighted categories with a total of 40 sub-categories. Each of the sub-categories has a number of questions giving points for different responses and a maximum score of 100 points is possible. Companies are encouraged to assess their own reports - it is not easy for this to be done externally as some of the questions require inside knowledge. The choice of actual EPIs does feature in this assessment, but only accounts for a few points. A higher points total is allocated to the reporting of selected indicators. Some areas are specifically highlighted, for example, packaging, which surprisingly is not covered in many reports from paper companies and others areas, like transportation, which are covered in-depth in quite a few reports.
| Table 1 - Deloitte Touche Tohmatsu’s Score Card for Environmental Reports |
| Category |
Maximum points |
Sub-categories |
| Corporate Profile |
10 |
Corporate context Management commitment Consideration of significant aspects Environmental policy and commitment |
| Report design |
15 |
Scope of report Rationale behind choice of EPIs Reporting and accounting policy Description of relatedness/pertinence Coverage |
| Environmental impact and data |
20 |
Inputs and emissions Waste/residual products Packaging and transportation Product stewardship Land contamination and remediation Environmental effects Other significant factors |
| Environmental management |
20 |
Environmental goals and targets Environmental management system Contingency planning and risk management Research and development Life cycle design Environmental impact assessment |
| Finance and eco-efficiency |
10 |
Environmental costs/investments Environmental liability Government economic penalties/incentives Future cost/investments Business opportunities and risks |
| Stakeholder relations |
10 |
Employees Customers and consumers Contractors and suppliers Regulatory bodies Voluntary initiatives |
| Communication |
10 |
Layout and appearance of report Feedback mechanisms |
| Third-party statement |
5 |
Verification of report |
Seeking sustainability
One area which is noticeable in its absence in most environmental reports and EPI sets is sustainability (excluding sustainable forestry which is obligatory in reports from most paper companies). Sustainability is all about integrating the environment with management of the social and economic aspects of the organization or industrial sector - sometimes referred to as management of the triple bottom line.
The UK started the EMS ball rolling in the early 1990s with BS 7750 (the forerunner of ISO 14001) and it looks as though the country could also set the pace in developing a sustainable management standard (SMS). Although many organizations were involved in developing BS 7750, the work was led by the British Standards Institution (BSi) which is now working with Forum for the Future on an SMS under a contract from the UK government. However, like the EMS standards, it is unlikely to prescribe the parameters which need to be dealt with in any detail.
The content of environmental reports and what is addressed within an EMS is often very similar, and in the case of EMAS, the content is in fact identical. A document published earlier this year should be valuable in moving forward this wider type of management and reporting. This is the exploratory draft on "Sustainability Reporting Guidelines" from the Global Reporting Initiative (GRI), an offshoot of the Coalition for Environmentally Responsible Economics (CERES). The guidelines are currently in a pilot testing phase and should be rolled out in their final form in early 2000. The suggested report has nine main sections: CEO statement, overview of key indicators, profile of reporting entity, policies/organization/management systems, stakeholder relationships, management performance, operational performance, product performance, sustainability overview.
The operational section covers most of the usual aspects/burdens, such as resource utilization and emissions, although the latter are referred to somewhat quaintly as "non-product output". The guidance for even these well-established areas is rather sketchy and the only suggestions for parameters in the discharges to water sub-section are COD (chemical oxygen demand), BOD, priority heavy metals and persistent organic pollutants. The sub-section on social and economic parameters is broken down into five areas - corporate, employee, community, supplier and customer.
In terms of groundbreaking progress, the last section is arguably the most important one. The reporter has to show how the organization has integrated sustainable thinking into its core decision-making processes. This could involve showing how purely financially-driven values (for example, maximizing shareholder value) have had to be modified in order to also be considered as sustainable. As it is virtually impossible for any organization to jump from their present status to one of a high degree of confidence in their sustainability, the draft suggests the use of themes or case studies to illustrate how this is being tackled in defined areas.
In PPI’s February 1998 article on environmental reporting, the Canadian group, EB Eddy (which has since been taken over by Domtar) was mentioned as one of the few companies that had started incorporating social and economic indicators into its innovative report on sustainable development. Outside the paper business, the Shell group has not only published separate health, safety, environment and social reports, but has also released ‘The Shell Report’ on its sustainable development performance. For a company founded on a relatively short-duration, non-renewable set of resources, this presents a severe challenge and several pages of the report are accordingly devoted to climate change and the development of less carbon-intensive fuels and renewable energy sources.
This report is a prototype of an integrated financial, environmental and social report along the lines envisaged by the GRI. Although the printed version of Shell’s report uses paper with the Nordic Swan eco-label, produced at a mill certified to ISO 9002 and 14001, using pulp wood from a sustainably-managed forest, one of the big sustainability questions for paper companies is how many people will handle the hard copy in preference to the soft version downloaded from Shell’s web site? That’s a tough question indeed, but fortunately for this writer, it is one for another day in another millennium.
Leslie Webb would welcome information on how mills have developed EPIs within reporting systems and can be contacted on telephone/fax +44 1372 276599 or email leswebb@compuserve.com
|