|
Month in Statistics

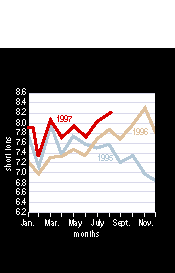
U.S. production of paper and paperboard (seasonally unadjusted) during the first eight months of 1997 rose 6% over the same period last year, according to the American Forest & Paper Assn. Paper production through August was 29.736 million tons, 6.5% higher than the 1996 period, and paperboard gained 5.6% with a total of 33.304 million tons for the same period.
Among major grades (on a year-to-date basis), coated paper shipments were up 18.3% from a year ago, newsprint production rose 5.1%, and tissue was up 3.1%. Most grades continued to rise for the eight months: unbleached kraft liner rose 4.8% and total packaging and other papers fell 1.1% when compared with last year. Both U.S. market woodpulp and total woodpulp production were up in August compared with the same month last year-3.7% and 1.7%, respectively. Consumption of recovered paper at U.S. mills for August was at 3.2 million tons, up 4.9% from the year-ago period.
Canadian newsprint shipments totaled 566,338 tons in August, up
3.2% from August 1996. Newsprint mills operated at 89% of capacity. Canadian woodpulp shipments were down
10.1% from August 1996 and reached
6.9 million metric tons for the
year-to-date, with mills operating at
87% of capacity in August.
|
Latest month
(000 short tons) |
% change
from
year ago |
Annualized
year-to-date
(000 short tons) |
% change
from
year ago |
| PAPER AND PAPERBOARD PRODUCTION1 |
| Newsprint |
August |
618 |
5.6 |
7,232 |
5.1 |
| Uncoated groundwood (s) |
August |
171 |
1.8 |
2,013 |
0.5 |
| Coated paper (s) |
August |
795 |
10.4 |
9,285 |
18.3 |
| Uncoated free-sheet 7 |
August |
1,188 |
2.2 |
13,840 |
5.2 |
| Other printing/writing 7 |
August |
139 |
6.9 |
1,570 |
-5.8 |
| Total packaging and other paper |
August |
362 |
-5.5 |
4,281 |
-1.1 |
| Tissue |
August |
543 |
1.1 |
6,382 |
3.1 |
| Total paper |
August |
3,815 |
3.6 |
44,604 |
6.5 |
| Unbleached kraft paperboard |
August |
2,034 |
1.5 |
22,850 |
3.7 |
| Semichemical medium |
August |
543 |
14.8 |
6,081 |
11.6 |
| Bleached paperboard |
August |
483 |
7.6 |
5,640 |
8.4 |
| Recycled paperboard |
August |
1,328 |
1.8 |
15,386 |
5.1 |
| Total paperboard |
August |
4,388 |
3.8 |
49,957 |
5.6 |
| Total paper and paperboard 5 |
August |
8,203 |
3.7 |
94,560 |
6.0 |
| PULP, WASTEPAPER, AND FIBER2 |
| Total woodpulp production |
August |
5,651 |
1.1 |
65,314 |
1.7 |
| Market pulp production |
August |
780 |
5.1 |
8,490 |
3.7 |
Wastepaper consumption
at paper/board mills |
August |
3,168 |
17.8 |
n.a. |
4.9 |
| CONVERTED PRODUCTS STATISTICS3 |
Corrugated box shipments
(billion ft2) 6 |
August |
32.882 |
0.4 |
258.785 |
2.1 |
Containerboard inventories
at mills/plants |
August 31 |
2.544 |
-7.8 |
- |
- |
| INTERNATIONAL TRADE2 |
| U.S. paper imports (including products) |
July |
1,322 |
10.8 |
15,253 |
18.5 |
| Imports of Canadian newsprint |
July |
566 |
4.2 |
7,052 |
3.2 |
| U.S. paper exports (including products) |
July |
1,084 |
-0.6 |
13,242 |
14.1 |
| Exports of unbleached kraft liner |
July |
381 |
-9.1 |
4,452 |
25.3 |
| Exports of woodpulp |
August |
541 |
-15.2 |
6,462 |
-2.7 |
| CANADIAN STATISTICS4 (reported in metric tons) |
| Total newsprint shipments 6 |
August |
737 |
2.5 |
6,303 |
11.4 |
| Operating rates, % |
August |
89 |
89 |
95 |
91 |
Inventories held by
U.S. consumers 6 |
Aug. 31 |
990 |
-2.2 |
- |
- |
| Woodpulp shipments 6 |
August |
833 |
-10.1 |
6,965 |
4.7 |
| Operating rates, % |
August |
87 |
94 |
91 |
89 |
| 1. American Forest & Paper Assn. 2. AF&PA, Bureau of Census, American Pulpwood Assn. 3. Fibre Box Assn., Paperboard Packaging Council. 4. Canadian Pulp and Paper Assn. 5. Includes construction and wet machine grades. 6. Not annualized. (s) = Shipments. 7. Categories have been revised: thin papers, previously included under the "other printing/writing" category, is now part of uncoated free-sheet. "Other printing/writing" now encompasses only bristols and cotton fiber papers. n.a. = not available. |
 |


