|
Month in Statistics
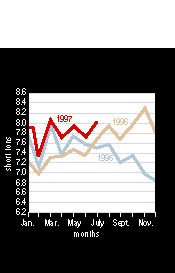
U.S. production of paper and paperboard (seasonally unadjusted) during the first seven months of 1997 rose 6.2% over the same period last year, according to the American Forest & Paper Assn. Paper production through July was 25.924 million tons, 6.9% higher than the 1996 period, and paperboard gained 5.5% with a total of 28.804 million tons for the first half of 1997.
Among major grades (on a year-to-date basis), coated paper shipments were up 19.7% from a year ago, newsprint production rose 5%, and tissue was up 3.4%. Most grades continued to rise and for the seven months, unbleached kraft liner rose 4.9% and total packaging and other papers were stagnant when compared with last year. Both U.S. market woodpulp and total woodpulp production were up in June compared with the same month last year, 3.8% and 1.8%, respectively. Consumption of recovered paper at U.S. mills for July was just under 3 million tons, up 4.8% from the year-ago period.
Canadian newsprint shipments totaled 575,000 tons in July, up 2.6% from July 1996, but down 6.8% from
June 1997. Newsprint mills operated at 94% of capacity. Canadian woodpulp shipments were down 0.6% from July 1996 and reached 6.1 million metric tons for the year-to-date, with mills operating at 94% of capacity in July.
|
Latest month
(000 short tons) |
% change
from
year ago |
Annualized
year-to-date
(000 short tons) |
% change
from
year ago |
| PAPER AND PAPERBOARD PRODUCTION1 |
| Newsprint |
July |
619 |
4.9 |
7,206 |
5.0 |
| Uncoated groundwood (s) |
July |
167 |
-8.2 |
2,004 |
-0.3 |
| Coated paper (s) |
July |
800 |
17.5 |
9,249 |
19.7 |
| Uncoated free-sheet 7 |
July |
1,166 |
3.4 |
13,770 |
5.5 |
| Other printing/writing 7 |
July |
132 |
5.6 |
1,556 |
-6.7 |
| Total packaging and other paper |
July |
359 |
-0.3 |
4,293 |
0.0 |
| Tissue |
July |
545 |
6.0 |
6,363 |
3.4 |
| Total paper |
July |
3,789 |
5.8 |
44,441 |
6.9 |
| Unbleached kraft paperboard |
July |
1,971 |
1.3 |
22,528 |
3.6 |
| Semichemical medium |
July |
525 |
13.1 |
5,989 |
11.0 |
| Bleached paperboard |
July |
477 |
3.5 |
5,618 |
8.7 |
| Recycled paperboard |
July |
1,254 |
1.0 |
15,243 |
5.1 |
| Total paperboard |
July |
4,228 |
2.8 |
49,378 |
5.5 |
| Total paper and paperboard 5 |
July |
8,016 |
4.2 |
93,819 |
6.2 |
| PULP, WASTEPAPER, AND FIBER2 |
| Total woodpulp production |
July |
5,670 |
0.5 |
65,001 |
1.8 |
| Market pulp production |
July |
801 |
20.1 |
8,386 |
3.8 |
Wastepaper consumption
at paper/board mills |
July |
2,970 |
7.1 |
n.a. |
4.8 |
| CONVERTED PRODUCTS STATISTICS3 |
Corrugated box shipments
(billion ft2) 6 |
July |
33.773 |
2.2 |
225.902 |
2.3 |
Containerboard inventories
at mills/plants |
July 31 |
2.536 |
-11.9 |
- |
- |
| INTERNATIONAL TRADE2 |
| U.S. paper imports (including products) |
June |
1,322 |
14.6 |
15,132 |
9.1 |
| Imports of Canadian newsprint |
June |
575 |
9.1 |
7,095 |
2.6 |
| U.S. paper exports (including products) |
June |
1,057 |
4.8 |
13,281 |
15.3 |
| Exports of unbleached kraft liner |
June |
366 |
11.2 |
4,432 |
27.1 |
| Exports of woodpulp |
July |
536 |
7.6 |
6,340 |
-2.4 |
| CANADIAN STATISTICS4 (reported in metric tons) |
| Total newsprint shipments 6 |
July |
791 |
12.0 |
5,565 |
12.7 |
| Operating rates, % |
July |
94 |
89 |
96 |
92 |
Inventories held by
U.S. consumers 6 |
July 31 |
1,009 |
-1.8 |
- |
- |
| Woodpulp shipments 6 |
July |
837 |
-0.6 |
6,132 |
7.1 |
| Operating rates, % |
July |
94 |
94 |
92 |
88 |
| 1. American Forest & Paper Assn. 2. AF&PA, Bureau of Census, American Pulpwood Assn. 3. Fibre Box Assn., Paperboard Packaging Council. 4. Canadian Pulp and Paper Assn. 5. Includes construction and wet machine grades. 6. Not annualized. (s) = Shipments. 7. Categories have been revised: thin papers, previously included under the "other printing/writing" category, is now part of uncoated free-sheet. "Other printing/writing" now encompasses only bristols and cotton fiber papers. n.a. = not available. |
 |