| U.S. PAPER AND BOARD PRODUCTION |
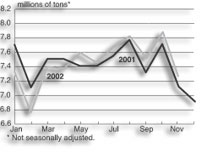
Total U.S. paperboard production in December of 3.7 million tons was 3.0% higher than December of 2001, according to statistics from the American Forest & Paper Assn. (AF&PA).
U.S. paperboard production totaled 47.7 million tons for the year. Year-to-date through December 2002, total board production increased 2.0%, according to the AF&PA.
U.S. market pulp production decreased 9.2% on a year-over-year basis in December to 697,000 tons.
Imports of newsprint from Canada totaled 561,000 tonnes in November, up 2.0% from 2001, according to the AF&PA.
U.S. uncoated free-sheet production was 1.0 million tons in December, up 2.5% from year-ago figures. Coated paper production increased to 742,000 tons in December, up 15.8% from year-ago figures.
|
|
 |
|
|
| MONTH IN STATISTICS |
| |
|
Latest month (000 short tons) |
% change from year ago |
Annualized year-to-date (000 short tons) |
% change from year ago |
| PAPER AND PAPERBOARD PRODUCTION1 |
| Newsprint |
December |
478 |
3.7% |
5,785 |
–9.1% |
| Uncoated groundwood (s) |
December |
n.a. |
n.a. |
n.a. |
n.a. |
| Coated paper (s) |
December |
742 |
15.8 |
8,940 |
0.6 |
| Uncoated free-sheet 7 |
December |
1,001 |
2.5 |
12,486 |
–1.3 |
| Other printing/writing 7 |
December |
103 |
5.1 |
1,359 |
–1.4 |
| Total packaging and other paper |
December |
333 |
–0.6 |
4,100 |
–4.4 |
| Tissue |
December |
614 |
8.9 |
7,107 |
1.2 |
| Total paper |
December |
n.a. |
n.a. |
n.a. |
n.a. |
| Unbleached kraft paperboard |
December |
1,736 |
5.5 |
21,123 |
3.4 |
| Unbleached kraft linerboard |
December |
1,219 |
7.0 |
15,041 |
-3.4 |
| Semichemical medium |
December |
466 |
2.9 |
5,837 |
4.6 |
| Bleached paperboard |
December |
442 |
-2.0 |
5,293 |
–0.1 |
| Recycled paperboard |
December |
1,103 |
–1.0 |
15,493 |
0.0 |
| Total paperboard |
December |
3,738 |
3.0 |
47,745 |
2.0 |
| Total paper and paperboard 5 |
December |
n.a. |
n.a. |
n.a. |
n.a. |
| PULP, WASTEPAPER, AND FIBER2 |
| Total woodpulp production |
December |
4,868 |
2.4 |
58,066 |
0.0 |
| Market pulp production |
December |
697 |
–9.2 |
8,469 |
3.6 |
| Wastepaper consumption at paper/board mills |
December |
2,687 |
-0.2 |
35,012 |
–0.6 |
| CONVERTED PRODUCTS STATISTICS3 |
| Corrugated box shipments (billion ft2) 6 |
December |
28.809 |
1.2 |
379.449 |
0.0 |
| Containerboard inventories at mills/plants(actual) |
December |
2,867 |
4.2 |
n.a. |
n.a. |
| INTERNATIONAL TRADE2 |
| U.S. paper imports (including products)* |
November |
1,654 |
6.2 |
16,951 |
–8.7 |
| Imports of Canadian newsprint* |
November |
561 |
2.0 |
6,128 |
0.5 |
| U.S. paper exports (including products)* |
November |
945 |
–1.6 |
10,004 |
–12.2 |
| Exports of unbleached kraft liner** |
November |
244 |
–15.3 |
2,526 |
–15.3 |
| Exports of woodpulp* |
December |
431 |
–15.2 |
5,923 |
13.8 |
| CANADIAN STATISTICS4 (reported in metric tons) |
| Total newsprint shipments 6 (metric tons) |
December |
742 |
13.3 |
8,492 |
1.4 |
| Operating rates, % |
December |
91 |
18.2 |
91 |
1.1 |
| Inventories held by U.S. consumers 6 |
December |
924 |
0.9 |
n.a. |
n.a. |
| Woodpulp shipments 6 |
November |
894 |
8.6 |
9,606 |
2.2 |
| Operating rates, % |
November |
93 |
-5.1 |
90 |
3.4 |
| (s) = Shipments. n.a. = not available. *According to the AF&PA, the harmonized code definitions for import/export data have been revised by the Census Bureau for 2002. Therefore, 2002 data are not directly comparable to previous years' data. **actual figure in tonnes. 1. American Forest & Paper Assn. 2. AF&PA. 3. Fibre Box Assn., AF&PA. 4. Pulp and Paper Products Council. 5. Includes construction and wet machine grades. 6. Not annualized. 7. Categories have been revised: thin papers, previously included under the "other printing/writing" category, is now part of uncoated free-sheet. "Other printing/writing" now encompasses only bristols and cotton fiber papers. |
|
|