|
In the pulp and paper industry, large amounts of capital are employed in the manufacturing process, and it is increasingly important to gain the highest profit return on these assets. A properly executed maintenance program is a strategic tool, ensuring continued generation of benefits by effectively maintaining and supporting applied technologies. Sustaining benefits through support strategies maximizes life-cycle returns and improves capital efficiency.
Continued success in a capital-intensive industry requires service practices that sustain increased value and improve the return on investment. From initial concept and justification analysis to ongoing support and migration to new technologies, an investment should capture the total life-cycle management. By sel-ecting a complete life-cycle service portfolio that add-resses the best practices in service and support, the pulp and paper industry can improve capital efficiency.
A screen shot shows an area of the press center roll selected by the operator to be monitored. The operator then establishes limits on the allowable movement from the area, including the red lines, which indicate alarm conditions if the angle changes or the sheet moves past the limit.
DOMTAR PAPER WEB MONITORING INSTALLATION. A recent example of how maintenance systems provide financial returns can be seen with a recent installation at Domtar’s Cornwall, Ont., mill. The installation of a web monitoring system and a web defect detection system has made life easier for operators in Cornwall. According to No. 6 paper machine coordinator Rick Black, both systems, which have been operational since mid-January 2000, are the best thing that’s happened to the machine.
Cornwall’s No. 6 machine produces lightweight copy paper and bright white offsets. Reoccurring sheet breaks and web defects, such as blotches and slime holes, had plagued operators and had been a major source of quality-related complaints, cull, machine downtime, and inefficiency. However, getting to the root of the problem was not always easy. According to Black, “We could spend hours, even days, looking for the source of the problem. Now we have a rapid troubleshooting tool.”
The monitoring system includes 12 online cameras, mounted where breaks are most likely to happen, that provide high resolution images of the fast moving web. These can be viewed by the operator to establish the exact cause of the break. According to Dale Bingley, quoted in Domtar Papers’ internal newsletter, “The annual savings of this project are estimated at $293,700, while potential profit generated from added sales is $207,800. Based on performance since installation, it is expected that the total benefits will far surpass original estimates.”
The objective of a video camera system is to assist with identification and prevention of sheet breaks by locating cameras at various locations along the machine. Typically, cameras are located on the tending side and drive side of the machine.
Playing back videos as the break is occurring performs sheet break analysis. By stopping the video at the critical point of sheet break and evaluating individual video frames, valuable insight into the nature of the break can be determined. The effectiveness of a system to serve this need is dependent on a few essential functions:
• Ability to quickly locate the essential information about the break
• Ability to quickly view the same part of the sheet at the various machine direction locations
• Ability to share the essential information with appropriate personnel so the best decision can be made.
• Ability to utilize the system to determine when conditions leading to a break are developing.
Effective utilization of video camera break systems is achieved when the monitoring system computer is used to accomplish two objectives:
1. Help the operator prevent breaks by alerting him to conditions that, if left uncorrected, will cause a sheet break.
2. When a break occurs, help the operator quickly identify the cause so action can be taken to prevent the break from reoccurring.
Break prevention is achieved by continuously monitoring critical locations and using the system computer to give warnings or alarms when conditions leading up to a break are developing. Two examples of this are release angle from a press center roll and trim squirt operation.
Press center roll: The operator selects the area to be monitored and then establishes limits on the allowable movement from the selected area. Should the angle change or should the sheet move past the limit, first a warning and then an alarm is provided to alert the operator to the condition.
Trim squirt operation: The video camera system can track the buildup on items such as the trim squirt. Once a sufficient amount of stock accumulates and creates a situation where falling debris could cause a break, the system will automatically alarm the operator to take preventive action.
Just as important as buildup on the trim squirt is its proper operation to precisely cut the sheet. In this case, the video camera system “watches” the area of the sheet where trimming occurs to assure that a complete cut is made for proper operation of the forming section. Quickly finding the cause of the sheet break requires that the video camera system help the operator find the essential information about the break quickly.
Video camera based web analysis equipment has proven to be a valuable investment for the papermaker. Typical results achieved include:
• Breaks per day reduced 30% to 60%
• Lost time for breaks reduced by 30% to 60% as breaks are reduced
• Machine efficiency improvement of 1% to 10%
In the example of a trim squirt for cutting the sheet, a video camera system can monitor buildup on the trim squirt to avoid falling debris and can also monitor the sheet area where trimming occurs so that a proper cut is made.
AVOIDING EQUIPMENT PERFORMANCE DEFECTS. Process downtime caused by unplanned equipment outages has a direct impact on the financial performance of a mill by reducing revenue and increasing cost. Many processes run at full capacity to reduce per-unit costs, and unavailability of these processes cuts significantly into production. Unavailability can be measured at the bottom line in the form of return on capital employed (ROCE). Poor availability has three effects on ROCE:
• Revenues are reduced by lower production
• Maintenance costs are higher for unplanned breakdowns
• More capital is employed in the form of redundant or oversized assets to increase availability.
The decision process used to address equipment availability today is like any other informal decision-support model in that it is highly interactive, involving someone’s time to make the analysis and implement an action plan (Figure 1). This decision process involves the following steps:
• An abnormal situation is detected by acquiring event and process data from the plant, via a distributed control system (DCS), dedicated condition monitoring systems, or an operator noticing a situation (visually, audibly, intuition), for example.
• Once the data has been acquired, the operator will evaluate the data by comparing against expectations and detecting inconsistencies between the acquired data and expectations in the current context. The operator will then begin to diagnose the problem, turning the symptoms into faults.
• When a fault is detected, the operator must decide what to do about it. This decision involves assessing the impact of possible actions and determining which one meets, or deviates least from, the current goals.
• Based on the impact assessment, the operator then plans and implements an action such as making a change to the process, resetting the expectation, or issuing a maintenance work order.
• The improvement cycle plays an essential role during the entire work process. It can be thought of as an “orient, decide, act” cycle operating on the work process itself.
Over time, the operator’s efforts become an informal process to maximize availabilityæan experienced operator can sense which equipment needs attention and when. The practical knowledge that an operator accumulates over years is usually not captured when the experienced operator moves on, through either job reassignment or retirement.
This informal means of managing asset availability can be compared with operating process controls in manual. Operating a process in manual control introduces variability into the process, which leads to reduced quality and throughput. Likewise, an informal approach to equipment availability leads to variability in production capability, as shown in the example below (Figure 2).
The process runs above the production target during periods when all mission-critical equipment is available and all or most operations are running at optimal levels. During some periods, the process runs below production target due to partial or complete unavailability (downtime) of a plant activity.
The financial impact of downtime can be measured as a part of the cost of poor quality (COPQ). COPQ includes business impact costs associated with any source that has a negative impact on process throughput or quality, including waste, rework, downgrades, blends, and obsolete inventory. Downtime has been found to account for 10% to 15% of the overall cost of poor quality (Figure 3).
There are six sources of downtime:
• Planned maintenance
• Unplanned maintenance
• External causes such as a power outage
• Process changeovers
• Process idle such as waiting for materials
• Other process operations such as human errors.
Overall COPQ for a business with 4 sigma (or 99.4%) yield, runs 15% to 20% of gross revenue. For a site with annual gross revenues of US$500 million, this translates to an overall COPQ of $75 million to $100 million. Downtime COPQ in this example can range from $8 million to $15 million/yr.
Most sites neither systematically measure these costs nor properly allocate them to their respective sources. Once statistical measurement and analysis can be made, the hidden profitability can be identified and a plan put in motion to recover it via reduced maintenance costs and increased revenues. Internally, Honeywell has defined, measured, and analyzed such opportunities with resulting significant returns.
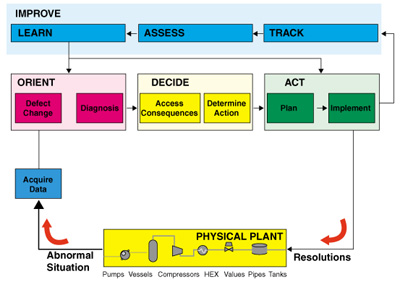
Figure 1. Most informal decision processes used to address equipment availability are highly interactive and involves someone’s time to analyze and implement the action plan. It is an unreliable process that typically leads to variable production capabilities.
HONEYWELL EXPERIENCE. In 1999, Honeywell merged with Allied Signal to become a $25 billion worldwide Fortune 50 company with 120,000 employees. Because of this, Honeywell has been able to tap into Allied experience and expertise. This experience is based on business improvements made from 1992 through 1999, when Allied’s defect-free throughput went from a 2 sigma level to 4.2 sigma, generating more than $2 billion in productivity savings along the way (Figure 4).
Honeywell found that enterprise asset management can be improved through Total Productive Maintenance practices and by applying the Six Sigma process to the problem of uncontrolled process variation caused by equipment performance defects. The Six Sigma process consists of:
• Defining a source of productivity waste
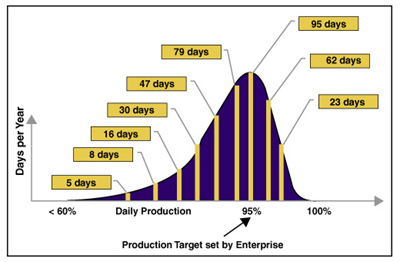
Figure 2. Informal decision-making produces a process where targets are met as long as all mission-critical equipment is available and operating at optimal levels but where the process runs below the target because of partial or complete downtime.
• Measuring th opportunity and its business value
• Analyzing the root causes of defects
• Improving the variability that is causing defects
• Controlling the variables that sustain the gains.
PARTS MANAGEMENT. Support of existing systems is extremely important. The cost of a part is more than the price of the part. The three major components of the total cost of a part are acquisition, holding, and application costs. The total cost of the part is the sum of these three components plus the original purchase price of the item.
The annual cost for inventorying a part is typically 20% to 35% of the purchase price. Benefits come from consolidating suppliers, reducing internal paperwork, locating parts, verifying prices, expediting deliveries, and freeing customer-purchasing personnel to specify and select high-cost items.
A parts management strategy of reduced cost of carrying inventory provides additional benefits in terms of eliminating risk of parts obsolescence. With delivery guarantee comes a decrease in the probability of process downtime. You may achieve savings of up to 35% over purchasing spare parts outright. The additional benefits include reduced spare parts inventory costs, reduced staff to manage parts, and mitigated risk of obsolescence.
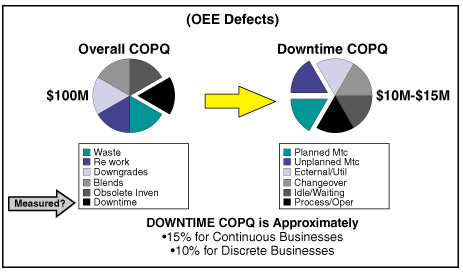
Figure 3. The cost of poor quality (COPQ) is typically not measured nor properly allocated to their respective sources. Thus, facilities are never able to realize their hidden profitability in recovering these costs.
WEB ASSET MANAGEMENT (WAM). WAM-enabling technologies will continue to increase. They have been documented to significantly reduce implementation and maintenance costs. WAM capability should help overcome the lack of trained resources, which has been reported as the biggest challenge with maintenance and support systems. They offer the benefit of being non-intrusive into the operations of the mill.
An example of WAM technology is the capability to diagnose and tune control loops over the Internet. This powerful tool for increasing mill efficiency is especially useful when new or modified process areas are being commissioned. Data is collected locally at the mill and then uploaded to the service provider’s location over the Internet. The loop data are then compared with benchmarks for control and valve performance, and a report based on the results is sent back to the mill via the Internet. This is an outstanding tool for mills located in remote locations, where staffing may be inadequate. One site documented $250,000 in annual savings through improved control in one important process control strategy.
Valve performance can also be monitored via the Internet when valve travel and cycle information is collected. The information provided helps mills identify and resolve potential problems with specific valves before they fail or become a problem.
Web asset management capabilities provide preventive maintenance for the industry. They reduce mill incidents and enable companies to focus their mill efforts. WAM technologies can even provide alarms for the engineer or operator while monitoring the process remotely and automatically.
WEB-BASED SERVICES. Web-based services use remote-access technology to deliver high-level expertise for improving control system and process performance. Taking advantage of remote-access capability and state-of-the-art health-monitoring software, web-based services significantly reduce the time required to resolve problems. Experts at a distant location are able to quickly determine possible causes of system degradation, as well as identify process optimization opportunities and deliver process solutions.
Sample offerings of Web-based services include:
• Remote diagnostics and troubleshooting: minimizes mean time to repair
• System software setup assistance: ensures optimal software configuration
• Operator refresher on-the-job training: keeps operators at peak performance
• Optimization recommendations: offers consultation for other needed services
• Sensor verification and system health monitoring: detects and corrects possible process and system degradation before process upsets
• Process optimization analysis/loop tuning analysis: achieves optimized process performance through analysis and planning
• Software archiving and backups: minimizes mean time to repair with current system data
• System and process benchmarking: achieves best of best performance and best practices
• Process/system utilization reporting: improves knowledge of your system and process parameters
• Scheduled portal services reports: ensures you have the right data at the right time for smart and educated decisions.
Web-based services provide a wide diversity of services to provide mills with an increasing level of benefits. A mill can select the service level best suited to give the maximum benefit-to-cost ratio for your situation, allowing the mill to run its operations in a proactive environment by minimizing system health issues. Optimization and health analysis provides the ability to raise product quality, avoid unnecessary downtime, and maintain a high level of product throughput.
MAXIMUM PAPER MACHINE EFFICIENCY. Monitoring various process variations on paper machines not only facilitates increased machine efficiency but also enables a new level of control that can significantly improve economic results. Unification of these information and production parameters provides the data-analysis tools required to determine optimal running conditions for all sections of the paper machine.
The correlation of production, process, and mechanical data enables increased efficiency, resulting in reduced component stresses, extended component life, and reduced energy consumption. This integration of monitoring and control information provides true, full-spectrum visibility to the paper machine process and enables immediate payback for the systems.
Full-spectrum visibility provides the link between process performance and paper quality variability from the wet end to the reel and beyond. Quality monitoring systems provide the tools to attack short-term product and process variations beyond the reach of conventional control systems. Quality monitoring systems consist of three common application modules:
• Pressure pulsation
• Nip vibrations
• Short-term quality measurements.
Pulsation monitoring detects and identifies pressure variations and pinpoints their sources, such as fan pumps and screens in the stock approach system. Nip monitoring analyzes the difference in nip direction movement between elements, such as two press rolls, and indicates each component’s variability contribution. Short-term quality monitoring provides visibility of the high-speed variations of the scanning product measurements (such as basis weight, moisture, and caliper) and provides diagnostics to pinpoint the location of the sources of these variations.
Condition monitoring applications detect problems on rotating machinery, such as bearings, gearboxes, pumps, and motors. The result is optimum maintenance scheduling, reduced labor costs, reduced spare parts inventory, and decreased potential for catastrophic failure. Scheduled machine shutdowns are leveraged for optimum machine operability, since corrective action is taken decisively, before a crisis, not during one. Condition monitoring continuously measures and analyzes the status of bearings, gearboxes, pumps, and motors. The result is reduced downtime and optimized use of scheduled shutdowns. This enables trouble-free machine operation during production and increases machine efficiency.
Condition monitoring benefits include:
• Avoid unexpected failures (and thus unplanned downtime)
• Provide “as-needed” maintenance
• Reduce spares inventory
• Preorder necessary spare parts
• Schedule necessary repairs during downtime
• Use manpower efficiently
• Improve paper machine performance beyond original limits.
Process trending capabilities for longer-term variations allow papermakers to optimize the papermaking process by monitoring essential parameters, such as flow, temperature, and loading, that relate to production goals and machine efficiency. By unifying this information with the results from short-term variation analysis and production data, papermakers gain total control of process variability. Process trending optimizes a paper machine’s running conditions by helping papermakers understand how long the process can run before a failure occurs or product quality forces a stop. The entire paper machine can run more efficiently by correlating short-term vibration and pulsation information with process and production information.
An example of the analysis capabilities provided by combining the data from a QCS and an online process variability monitoring system occurred at a mill in the Pacific Northwest (Figure 4). The third press fabric in the machine had just been changed and the result was an immediate increase in press section nip vibration, high variability in short term moisture data, and a significant increase in sheet breaks.
Knowing the source of the process disruption has helped the mill to work with its clothing suppliers to try to alleviate such disruptive startups of new fabrics.
Figure 4. Combining the data from a QCS and an online variability monitoring system helped one mill identify problems created when the third press felt in the paper machine was changed. The mill then worked with its clothing supplier to try and eliminate such disruptive startups.
Conclusion. Today’s business pressures require paper mills to maximize control system availability and performance in order to stay competitive. Having immediate access to experts with solutions to system and process problems creates a proactive environment that helps drive your business to peak operational performance. Being able to minimize downtime by improving mean time to repair (MTTR) is a competitive advantage.
To stay competitive, paper mills must produce more products by increasing machine efficiency and speed, while at the same time producing higher-quality paper. To achieve these goals today, it is necessary to know the performance of the machine sections and the effects of this performance on quality variations down the line.
The pulp and paper industry is under continuing pressure to increase the return on capital employed. A strategic approach to maintenance can help achieve this goal. Better management and coordination of pulp and paper operations means higher product quality and improved production rates. The results can be significant:
• Increased production uptime
• Minimized maintenance costs
• Increased sheet-to-sheet uniformity
• Reduced sheet breaks
• Reduced broke
• Increased component life
• Intelligent component selection
• Reduced spare parts inventory.
Scott Wilson is West mill automation engineer, and Rich Black is No. 6 paper machine operations coordinator, Domtar Inc, Cornwall, Ont. Keith Masters is manager, paper machine solutions, and Dan Millard is business development manager, Honeywell International, Phoenix, Ariz.

|