| |

Laboratory simulations and extended mills trials help Gulf States Paper, Demopolis, Ala., cut costs and prepare for ECF bleaching
By Johnnie Pearson, David E. Fletcher, J. Daniel Connell
Gulf States Optimizes Bleach Plant For Better Chemical Efficiency, Cost Control
In an effort to minimize bleaching costs and prepare for Cluster Rule compliance, Gulf States Paper Corp., Demopolis, Ala., completed a series of optimization steps at its bleach plant in 1999. The Demopolis mill utilizes Lo-Solids cooking and a short, three stage bleaching sequence for its hardwood kraft pulp production. The optimization steps used by the mill included both laboratory bleaching simulations and extended mill trials.
The optimization steps showed that peroxide reinforcement of the extraction stage allowed a statistically significant improvement in overall bleaching chemicals performance, as illustrated by the normalized oxidizing equivalent (OXE) versus brightness development curves. In addition, laboratory simulations of the final bleaching stage permitted identification of the optimum pH target for maximizing chemical efficiency. Laboratory results were then confirmed by extended mill trials and testing, so that third stage chemical efficiency was improved. The laboratory results were also found to be statistically significant by comparing the overall bleaching sequence normalized OXE versus brightness development curves.
As a result of the optimization process, chemical efficiency was improved, bleaching chemical costs were reduced, and bleached pulp viscosity was increased. In addition, bleach plant effluent adsorbable organic halides (AOX), chemical oxygen demand (COD), and color were reduced as compared with the baseline bleaching sequence. Long term, Gulf States expects that this optimization will also allow a smoother transition to elemental chlorine free (ECF) bleaching.
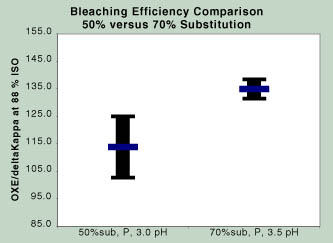
FIGURE 1: The Demopolis mill ran at two different chlorine dioxide substitution levels-50% and 70%. 70% substitution, there was an 18% increase in total bleaching chemicals applied.
BLEACH PLANT PROJECT. Bleach plant optimization activities were undertaken during 1999 at the Demopolis mill. The bleaching configuration at the outset of the project was DC-EO-D. With the project, the mill sought to develop the most efficient bleaching configuration possible and to maximize the distribution and efficiency of the bleaching chemicals applied. This would then reduce bleaching costs, maintain or improve pulp quality, and maximize environmental performance, while preparing for ECF bleaching.
The Gulf States' optimization process was divided into three phases. The first phase evaluated the benefits of peroxide reinforcement of the extraction stage. The next phase compared the impact of 50% versus 70% chlorine dioxide substitution. The last phase addressed optimizing the kinetics of the final chlorine dioxide stage.
When kraft pulps are bleached there are two main objectives. The first is fiber delignification and the second is brightening. Therefore, to properly compare the efficiency of a bleaching sequence, it is necessary to measure the quantity of chemicals consumed for both delignification (kappa reduction) and brightening (brightness response) purposes.1
During each phase of the optimization process at Gulf States, bleaching efficiency data was collected throughout the bleach plant in order to obtain bleaching profiles of each configuration. The comparison methodology chosen was one that involved brightness response, kappa reduction, and bleaching chemicals applied.
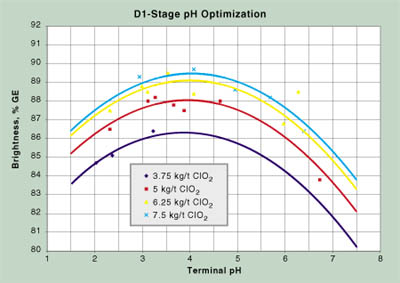
FIGURE 2: A laboratory simulation identified the optimum chlorine dioxide stage pH as 4.3.
PEROXIDE REINFORCEMENT. In the first phase of optimization, baseline comparison data was collected under normal operating conditions for the existing sequence, DC-EO-D. A hydrogen peroxide handling system was installed and started up, allowing the conversion to DC-EPO-D. Hydrogen peroxide was then charged at a rate of 10 lb/ton and additional sampling was conducted.
After peroxide addition, chlorine dioxide was reduced-primarily in the last stage-to achieve the final brightness target. On average, the addition of hydrogen peroxide increased second stage brightness by 10% GE, as compared to baseline levels.
The results show that, on the average, the normalized oxidizing equivalents needed to reach 88% GE decreased from 126 OXE/dKappa/ton to 114 OXE/dKappa/ton after peroxide addition. This represents a 9.5% reduction in total bleaching chemicals applied and an 8.8% reduction in total bleaching costs. In addition to the improvement in bleaching efficiency, the addition of hydrogen peroxide allowed an improvement in environmental performance. The parameters measured were AOX, COD, and color. The data was established by completing a material balance around the bleach plant to identify sewer flows during each sampling period. Overall, AOX decreased 10%, COD decreased 5%, and color decreased 25%.
CHLORINE DIOXIDE SUBSTITUTION. During the second phase of the optimization process, the Demopolis mill ran at two different chlorine dioxide substitution levels-50% and 70%. This provided an opportunity to compare the efficiency of the chemicals applied at the different substitution levels. The results showed that, on average, the normalized oxidizing equivalents needed to reach 88% GE increased from 114 OXE/dKappa/ton at 50% substitution to 135 OXE/dKappa/ton at 70% substitution. This represents an 18% increase in total bleaching chemicals applied and a 17% increase in total bleaching costs at 70% substitution (Figure 1). However, there was a decrease in viscosity at 50% substitution, which is discussed later in this article.
FINAL STAGE pH OPTIMIZATION. The third phase of the optimization process pertained to the last chlorine dioxide stage (D1). Prior to addition of hydrogen peroxide, the end of tower pH was not controlled and varied between 2.5 to 3.0. After the addition of hydrogen peroxide, the chlorine dioxide charge used decreased, resulting in an increase in pH to about 3. The optimum pH varies from mill to mill, so a laboratory simulation was completed to identify this optimum. Figure 2 shows the simulation results.
Based on the information obtained from the laboratory simulation, trials were completed in the Demopolis mill under controlled conditions to determine if the benefits seen from the simulation occurred under mill conditions. The targets chosen for comparison were 3.5 pH and 4.3 pH.
The results from these trials showed a 17% improvement in chemical application efficiency at 4.3 pH and 70% substitution as compared with 3.5 pH and 70% substitution. This improved efficiency allowed a reduction in the amount of chlorine dioxide applied in the third stage to reach 88% GE brightness, translating into chemical cost savings of 15%.
The net result of the three changes -addition of hydrogen peroxide, increased chlorine dioxide substitution, and final stage pH optimization-was that bleaching sequence efficiency improved by 10.4% and the total bleaching cost was reduced by 7.9% (Figure 3). In addition, environmental performance improved as it did in Phase I.
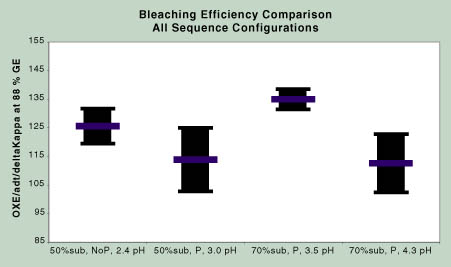
FIGURE 3: The net result of the three changes - addition of hydrogen peroxide, increased chlorine dioxide substitution, and final stage pH optimization - was that bleaching sequence efficiency improved by 10.4% and the total bleaching cost was reduced by 7.9%.
PULP QUALITY. An important parameter indicative of the relative differences in pulp strength is viscosity. The pulp viscosity was profiled throughout the Demopolis bleach plant during each of the major comparison periods.
A significant shift in viscosity occurred with increased chlorine dioxide substitution. The change from 50% to 70% chlorine dioxide substitution increased viscosity by 20%.
The sequence configurations can also be looked at in terms of selectivity. The bleach plant profile data was used to develop a comparison of kappa number versus viscosity, and Figure 4 shows the results. These results demonstrate that the baseline configuration was the least selective, while the configuration with 70% substitution, hydrogen peroxide reinforcement, and final stage pH control, at the optimum, generated the most selective option. Pulp dirt levels were not significantly affected.
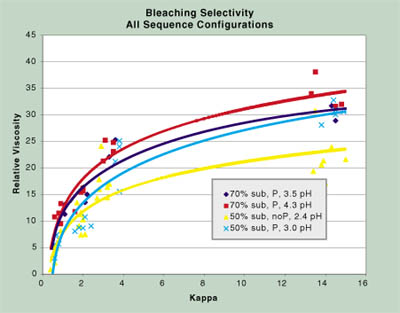
FIGURE 4: Bleach plant profile data show that the baseline configuration was the least selective option, while the configuration with 70% substitution, hydrogen peroxide reinforcement, and final stage pH control was the most selective.
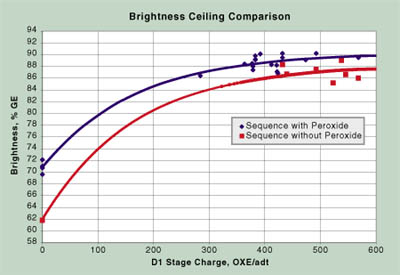
FIGURE 5: Bleaching sequences using hydrogen peroxide reinforcement in the second stage achieved a higher final pulp brightness.
BRIGHTNESS CEILING. The final comparison made between the initial bleaching sequence, DC-EO-D, and sequences using hydrogen peroxide reinforcement was with respect to bleached pulp brightness ceiling. Figure 5 shows the (D1)-stage charge versus brightness achieved. As can be seen, sequences using hydrogen peroxide reinforcement in the second stage achieved a higher final pulp brightness. The curve fitted to this data follows the mathematical expression published by McDonough2 for calculation of a pulp brightness ceiling. The results demonstrate that the brightness ceiling increased by an average of 2% GE with peroxide reinforcement in the second stage.
CONCLUSIONS. Improvements from the bleach plant optimization process at Gulf States impacted chemical efficiency, bleaching chemical costs, and bleach plant effluent. Long term, the Demopolis mill expects these improvements, as detailed in the following list, to provide a smoother transition to ECF bleaching.
- Chemical selectivity, distribution, and efficiency were improved. This resulted in an overall decrease in chemical consumption of 10.4% and a decrease in chemical costs of 7.9%. This also allowed an increase in the brightness ceiling of 2% GE.
- Pulp viscosity was increased by 20% when the chlorine dioxide substitution level was increased from 50% to 70%, due to improved bleaching selectivity.
- Environmental performance was improved. Bleach plant AOX, COD, and color were reduced by 10%, 5%, and 25%, respectively.
Johnnie Pearson is process engineer at Gulf States Paper in Demopolis, Ala. David E. Fletcher is technical marketing manager and J.Daniel Connell is senior process engineer at Eka Chemicals in Marietta, Ga. The authors would like to thank the bleach plant operators at Gulf States' Demopolis mill whose skillful work helped make this project a success. The authors also wish to thank the Eka Chemicals laboratory bleaching specialists whose analytical skills allowed us to properly assess and document these results.
References
- Fletcher, David E. & Connell, J. Daniel, "Comparing Bleaching Sequence Configurations With Respect to Chemical Efficiency and Brightness Response", 1997 Pulping Conference, San Francisco, p.97.
- McDonough, Thomas J., "Brightness Development in the Final CIO2 stages of an ECF Kraft Pulp Bleaching Sequence: Modeling and Effects of Pulping Conditions", 1996 Pulping Conference, p. 201.

|