| |
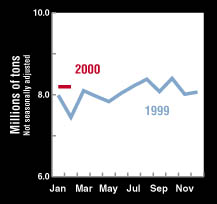 Total U.S. paper and paperboard production in January of 8.197 million tons was 2.6% higher than January 1999, according to statistics from the American Forest & Paper Assn. (AF&PA).
Paperboard production in January was up 3.7% to 4.384 million tons, while paper production was up 1.5% to 3.813 million tons. U.S. corrugated box shipments of 33.436 billion ft2 in January was down 1.0% from a year earlier.
U.S. market pulp production was up 15.4% to 764,000 tons, while Canadian market pulp shipments of 1.053 million mtons were up 16.9% from January 1999.
U.S. imports of paper in December of 1.491 million tons was up 5.1% from December 1999. Exports were 7.8% higher in December at 965,000 tons. Year-to-date U.S. paper imports were 8.7% higher at 18.064 million tons, while exports were 3.5% lower at 11.765 million tons, compared with a year earlier.
|
| |
Latest month (000 short tons) |
% change from year ago |
Annualized year-to-date (000 short tons) |
% change from year ago |
 |
| Newsprint** |
January |
669 |
6.7% |
669 |
6.7% |
| Uncoated groundwood (s) |
January |
158 |
0.0 |
158 |
0.0 |
| Coated paper (s) |
January |
774 |
3.1 |
774 |
3.1 |
| Uncoated free-sheet 7 |
January |
1,104 |
–3.6 |
1,104 |
–3.6 |
| Other printing/writing 7 |
January |
131 |
13.9 |
131 |
13.9 |
| Total packaging and other paper |
January |
n.a. |
n.a. |
n.a. |
n.a. |
| Tissue |
January |
n.a. |
n.a. |
n.a. |
n.a. |
| Total paper |
January |
3,813 |
1.5% |
3.813 |
1.5% |
| Unbleached kraft paperboard |
January |
1,960 |
112.1 |
1,960 |
9.0 |
| Semichemical medium |
January |
531 |
14.2 |
531 |
14.2 |
| Bleached paperboard |
January |
493 |
9.8 |
493 |
9.8 |
| Recycled paperboard |
January |
1,400 |
4.3 |
1,400 |
4.3 |
| Total paperboard |
January |
4,384 |
3.7% |
4,384 |
3.7% |
| Total paper and paperboard 5 |
January |
8,197 |
2.6% |
8,197 |
2.6% |
|
 |
| Total woodpulp production |
January |
5,508 |
8.0% |
5,508 |
8.0% |
| Market pulp production |
January |
764 |
15.4 |
764 |
15.4 |
| Wastepaper consumption at paper/board mills |
January |
3,135 |
–0.6 |
3,135 |
–0.6 |
 |
| Corrugated box shipments (billion ft2)6 |
January |
33.436 |
–1.0% |
32.404 |
–1.0% |
| Containerboard inventories at mills/plants(actual) |
January |
3,002 |
10.2 |
|
|
 |
| U.S. paper imports * |
December |
1,491 |
5.1% |
18,064 |
8.7% |
| Imports of Canadian newsprint |
December |
568 |
–2.1 |
6,619 |
6.3 |
| U.S. paper exports * |
November |
965 |
7.8 |
11,765 |
–3.5 |
| Exports of unbleached kraft liner |
December |
216 |
–16.3 |
3,133 |
–13.7 |
| Exports of woodpulp |
December |
503 |
11.5 |
503 |
11.5 |
|
 |
| Total newsprint shipments 6 (mtons) |
January |
749 |
2.3% |
749 |
2.3% |
| Operating rates, % |
January |
97 |
0.0 |
97 |
0.0 |
| Inventories held by U.S. consumers 6 |
January |
1,300 |
2.0 |
|
|
Woodpulp
shipments 6 |
January |
1,053 |
16.9 |
1,053 |
16.9 |
| Operating rates, % |
January |
100 |
7.5 |
100 |
7.5 |
|
 |
| **Year 2000 newsprint data compiled by Pulp & Paper Products Council and therefore are not fully comparable to 1999 data, which were compiled by the AF&PA.(s) = Shipments. n.a. = not available. 1. American Forest &Paper Assn. 2. AF&PA, Bureau of Census, American Pulpwood Assn. 3. Fibre Box Assn., Paperboard Packaging Council. 4. Canadian Pulp and Paper Assn. 5. Includes con-struction and wet machine grades. 6.Not annualized. 7.Categories have been revised: thin papers, previously included under the “other printing/writing” category, is now part of uncoated free-sheet. “Other printing/writing” now encompasses only bristols and cotton fiber papers. |

|