| |
 U.S. production of paper and paperboard rose 2% for the 11 months through November compared with the year-ago period. Paper production was up 1.7% while paperboard production increased 2.3%. Total paper and board volume was 88.6 million tons through November.
Canadian newsprint shipments totaled 8.3 million mtons for the 11 months, an increase of 7% over the 1998 period. Wood pulp shipments increased 9.3% during the same period to 8 million mtons.
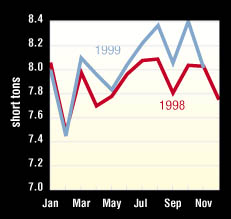
Through November, U.S. newsprint production was down 1.3% from the year-ago period at 6.5 million tons.
Fiber box shipments totaled 370 billion ft2 through November, an increase of 2.1% from the year-ago period. Containerboard inventories at box plants and mills measured 2.6 million tons, a decrease of 1.1% from the same month a year ago.
U.S. pulp production in November totaled 5.2 million tons, up 3.8% from November 1998. Market pulp production was up 2% in November at 668,000 tons.
|
| |
Latest month (000 short tons) |
% change from year ago |
Annualized year-to-date (000 short tons) |
% change from year ago |
 |
| Newsprint |
November |
605 |
–0.2% |
6,552 |
–1.3% |
| Uncoated groundwood (s) |
November |
169 |
–6.1 |
1,819 |
–3.7 |
| Coated paper (s) |
November |
805 |
12.6 |
8,757 |
2.5 |
| Uncoated free-sheet 7 |
November |
1,126 |
0.6 |
12,711 |
2.1 |
| Other printing/writing 7 |
November |
133 |
9.0 |
1,434 |
1.7 |
| Total packaging and other paper |
November |
n.a. |
n.a. |
n.a. |
n.a. |
| Tissue |
November |
n.a. |
n.a. |
n.a. |
n.a. |
| Total paper |
November |
3,801 |
4.2% |
41,689 |
1.7% |
| Unbleached kraft paperboard |
November |
1,825 |
117.4 |
21,186 |
–1.2 |
| Semichemical medium |
November |
476 |
7.2 |
5,352 |
–1.0 |
| Bleached paperboard |
November |
512 |
17.4 |
5,297 |
4.3 |
| Recycled paperboard |
November |
1,399 |
13.2 |
15,076 |
8.2 |
| Total paperboard |
November |
4,213 |
9.1% |
46,910 |
2.3% |
| Total paper and paperboard 5 |
November |
8,013 |
6.7% |
88,599 |
2.0% |
|
 |
| Total woodpulp production |
November |
5,247 |
3.8% |
57,578 |
–2.2% |
| Market pulp production |
November |
668 |
2.0 |
7,461 |
1.0 |
| Wastepaper consumption at paper/board mills |
November |
3,050 |
3.6 |
33,936 |
0.8 |
 |
| Corrugated box shipments (billion ft2)6 |
November |
32.615 |
6.2% |
369.955 |
2.1% |
| Containerboard inventories at mills/plants(actual) |
November |
2,699 |
–1.1 |
|
|
 |
| U.S. paper imports * |
October |
1,595 |
10.8% |
14,947 |
8.3% |
| Imports of Canadian newsprint |
October |
623 |
14.1 |
5,828 |
5.7 |
| U.S. paper exports * |
October |
995 |
1.4 |
9,803 |
–5.5 |
| Exports of unbleached kraft liner |
October |
223 |
–12.5 |
2,674 |
–14.3 |
| Exports of woodpulp |
October |
460 |
8.2 |
4,812 |
–3.2 |
|
 |
| Total newsprint shipments 6 (mtons) |
November |
764 |
13.0% |
8,345 |
7.0% |
| Operating rates, % |
November |
95 |
15.9 |
94 |
8.0 |
| Inventories held by U.S. consumers 6 |
November |
1,288 |
3.0 |
|
|
| Woodpulp shipments 6 |
November |
813 |
2.7 |
9,790 |
9.3 |
| Operating rates, % |
November |
92 |
8.2 |
94 |
9.3 |
|
 |
| (s) = Shipments. n.a. = not available. 1. American Forest &Paper Assn. 2. AF&PA, Bureau of Census, American Pulpwood Assn. 3. Fibre Box Assn., Paperboard Packaging Council. 4. Canadian Pulp and Paper Assn. 5. Includes construction and wet machine grades. 6. Not annualized. 7. Categories have been revised: thin papers, previously included under the “other printing/writing” category, is now part of uncoated free-sheet. “Other printing/writing” now encompasses only bristols and cotton fiber papers, *including products |

|